Enture Dashboard
Enture dashboard provides a visual representation of essential information and data, presented in a single, consolidated view. With the availability of high customization, the Enture dashboard can be designed to provide users with an at-a-glance overview of key performance indicators (KPIs), metrics, and data points relevant to a specific business or department.
The dashboard facilitates you for data-driven decision-making, monitoring performance, and tracking progress toward goals.
The customization is enabled through the use of multiple widgets such as Panel, Gauge, Parameter, and Machine, which can be configured as per the requirement.
Steps to Add Widgets to the Dashboard
-
Click on the Green pencil icon to switch to engineering access
-
Click on the Plus
button to add the widgets of choice (Panel, Gauge, Parameter, and Machine).
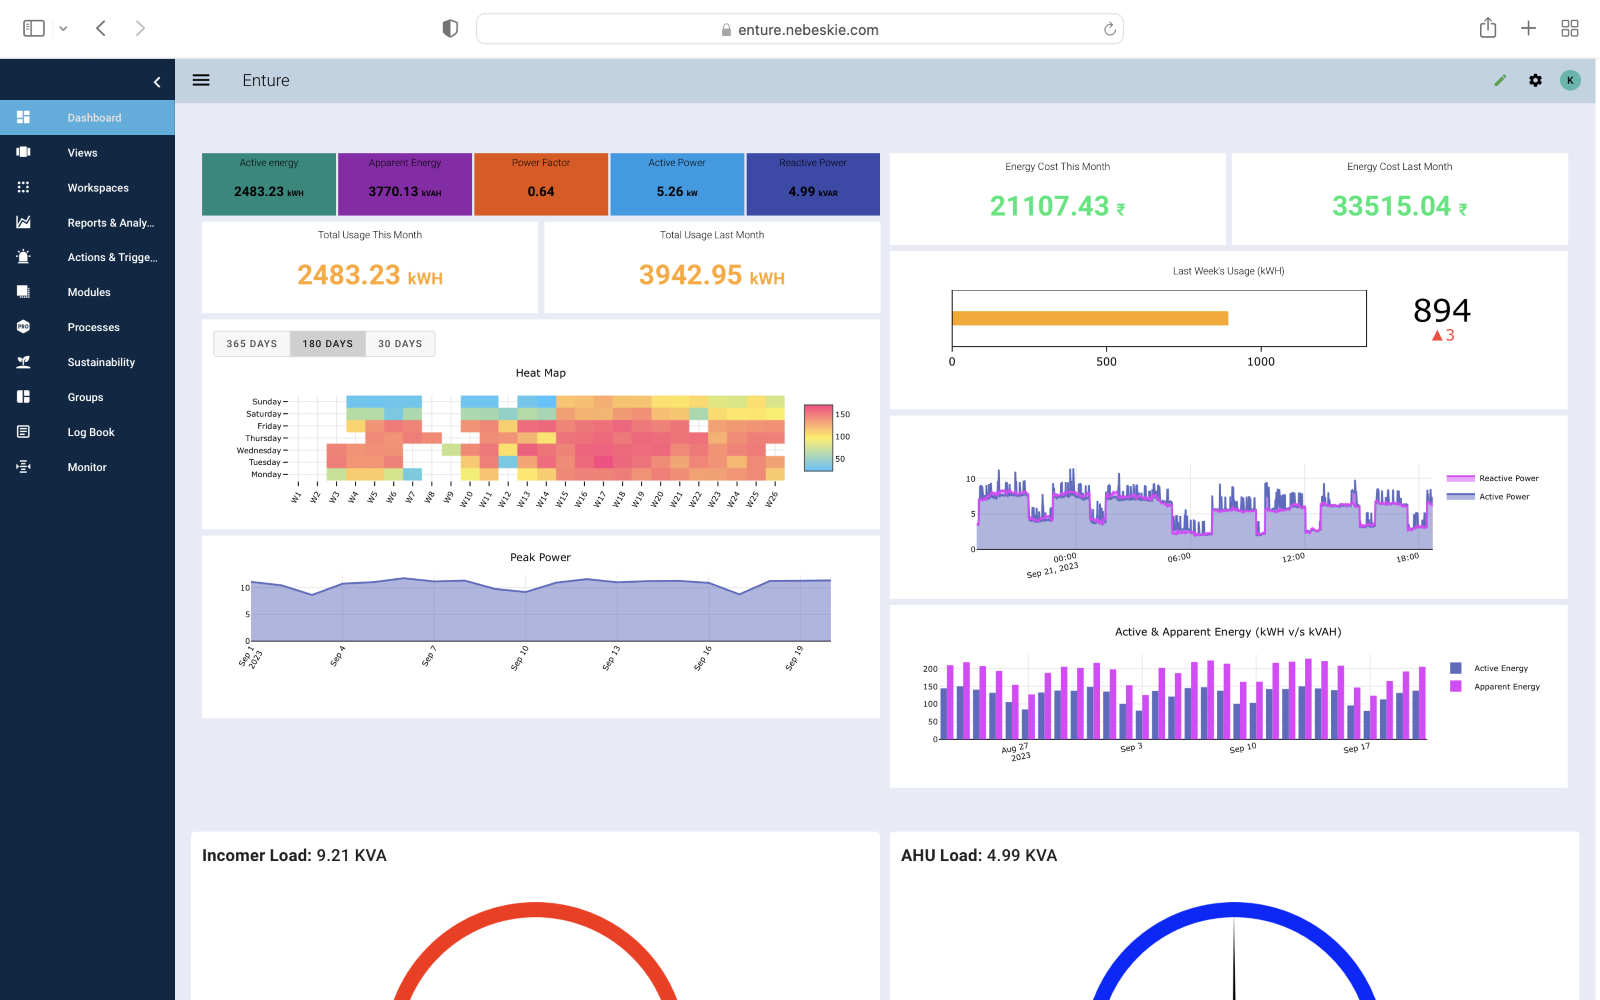
Fig 1: Dashboard with default settings.
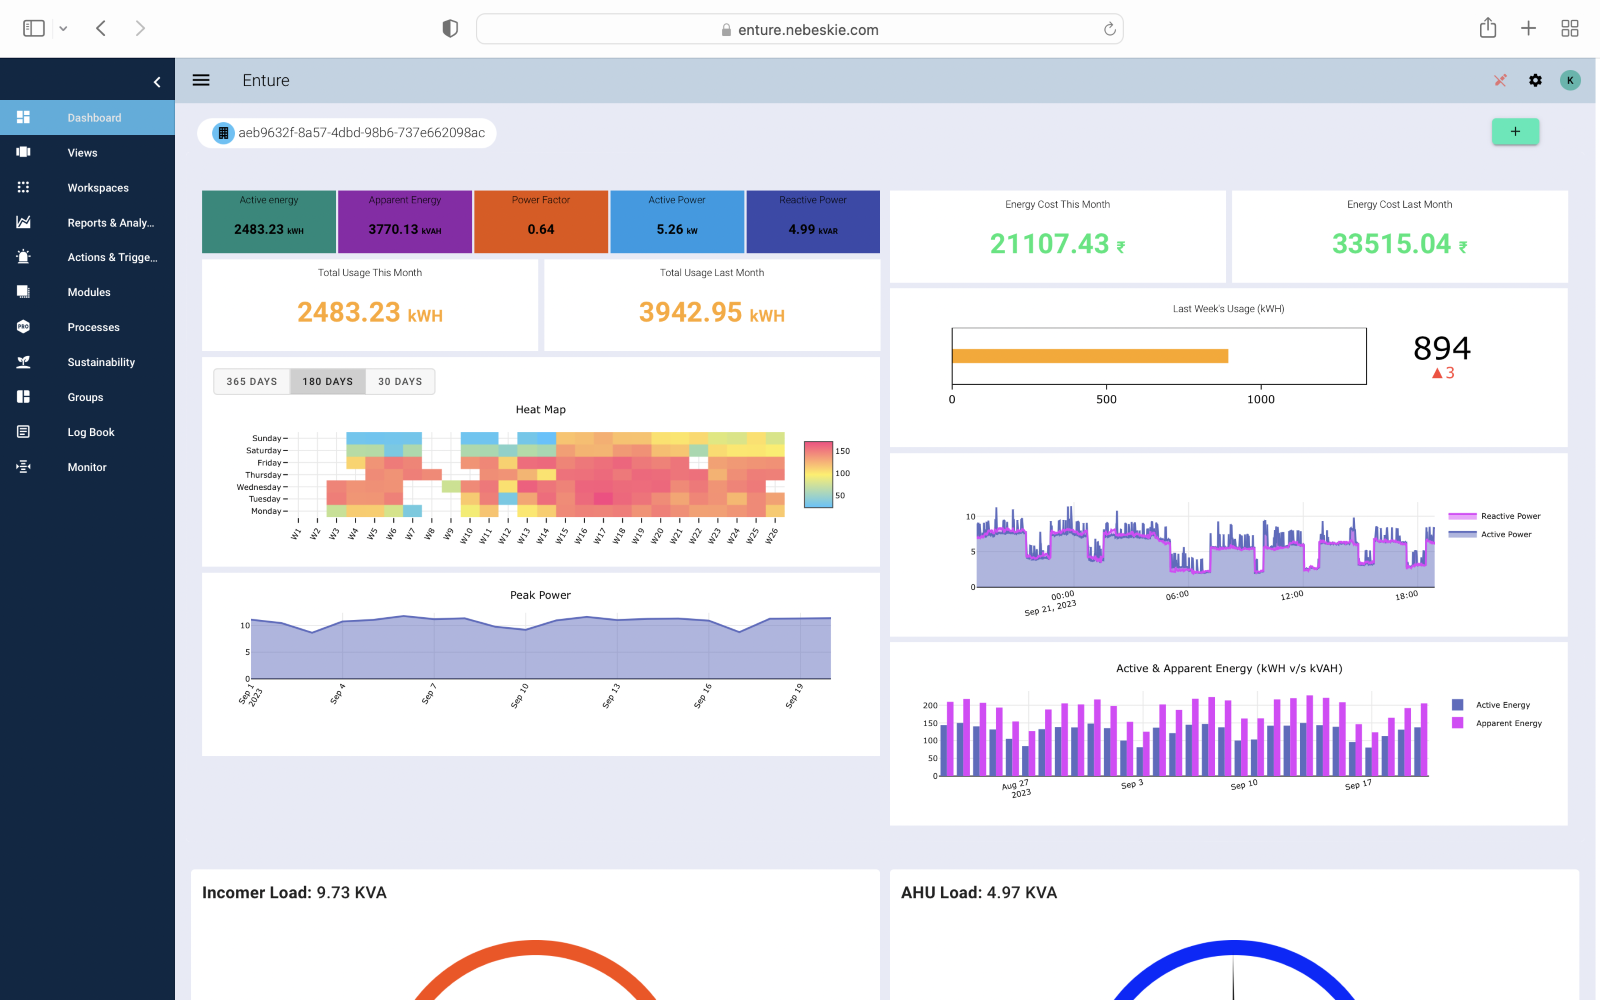
Fig 2: Dashboard with engineering access.